More Insights into Your Breed’s Health
The Health statistics provide a comprehensive overview of life expectancy, causes of death, and common diseases and health issues in the breed.
You can find the Health statistics under the FACTS menu.
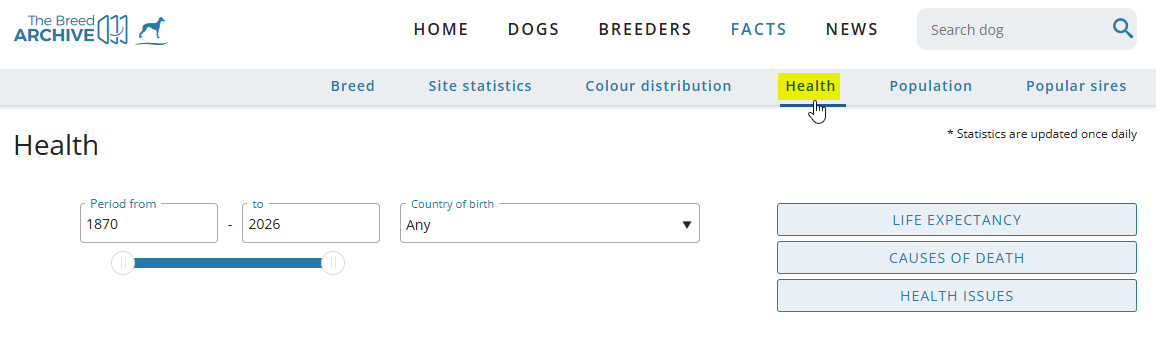
Please note that Health statistics are not (yet) available for newly created Archives or for Archives with insufficient evaluable data. As the statistics are based on data provided by the user community, no guarantee regarding their completeness and accuracy can be given.
Life expectancy
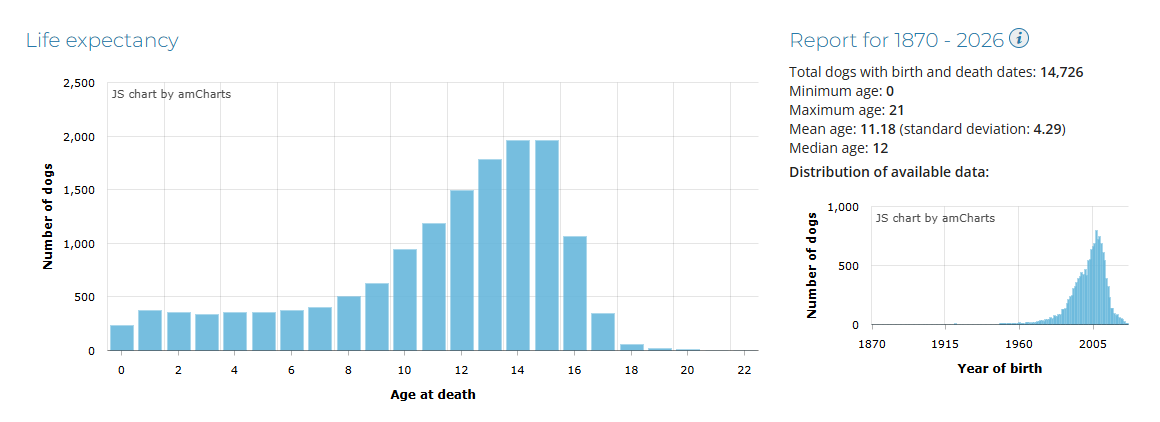
You can find information about how many dogs died at which age in the diagram of the first section. There you can also see the mean and the median age at death and how our data is distributed over time - naturally we have more data for more recent generations of dogs.
The Mean age at death is the mathematical average: You get this by adding up all lifespans and dividing by the number of dogs. This number is usually lower because it gets pulled down by tragic, early deaths (like accidents or puppy illnesses).
The Median age at death is the exact middle point: Exactly half of the dogs died younger than this age, and half lived longer. Because it ignores those early extremes, it often represents a more typical, natural lifespan for the breed.
Causes of death
Below the life expectancy overview, you will find the most common causes of death visualised in a box plot (also known as a box-and-whisker plot). This diagram not only ranks the causes of death by frequency, but also shows the age distribution for each cause.
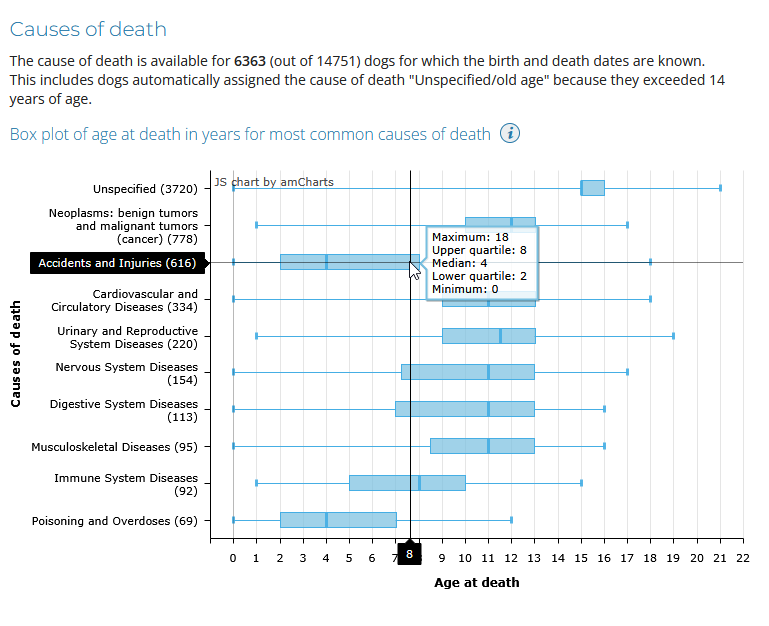
How to read the box plot:
- The Box: Shows where the middle 50% of the dogs fall.
- The left edge (lower quartile / Q1) means 25% of dogs died at a younger age than this point.
- The line inside the box is the median (the exact midpoint of the data).
- The right edge (upper quartile / Q3) marks the point above which 25% of dogs died at an older age.
- The Whiskers (horizontal lines): Extend outward from the box to show the overall age range (minimum and maximum typical values), illustrating how widely spread the ages are for a specific cause of death.
Across most dog breeds, neoplasms (tumors/cancers) tend to be the top recorded cause of death. Categories like accidents and injuries also frequently rank near the top, but their box plots typically skew much further to the left—reflecting a higher frequency in younger dogs.
Health issues
The last section provides a comprehensive overview of reported health issues and diagnostic test results for the breed.
What is included in the statistics?
To keep the data meaningful, health issues are included if they have been reported more than five times for a breed. For archives with smaller populations, all reported issues are displayed regardless of count.
For diagnostic or genetic tests, we count all results that are not considered normal or optimal (for example, genetic test results marked as affected or patella scores other than normal).
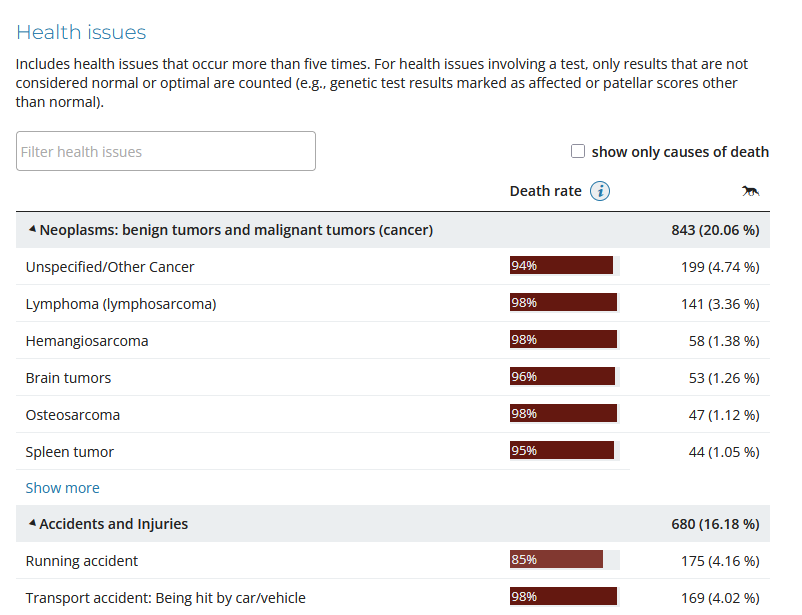
The table is sorted by frequency, placing the most commonly reported health conditions right at the top. Each entry shows the total number of recorded cases alongside its percentage relative to all health issues.
Health issues are grouped into broader medical categories (e.g., Neoplasms, Cardiovascular and Circulatory Diseases) with specific conditions listed underneath.
Death rate display
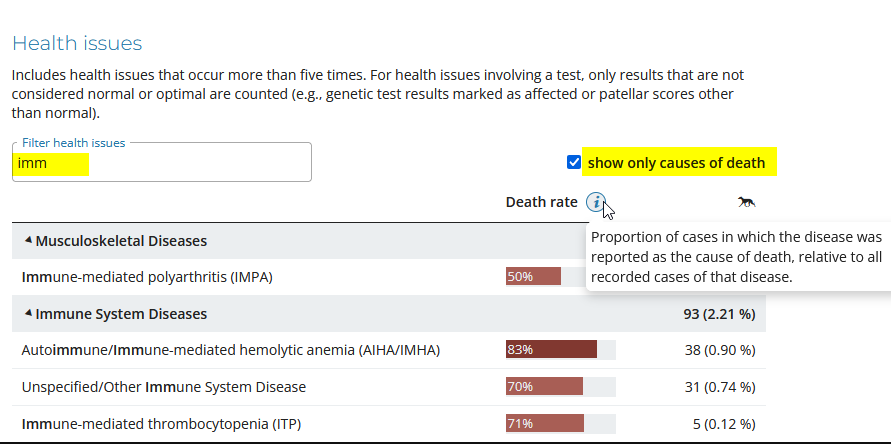
You will also notice a Death rate column represented by a coloured visual bar. It visualises the proportion of cases where a specific disease was reported as the actual cause of death:
- An almost full, dark red bar (e.g., 98%) indicates that the condition is almost always reported as the cause of death and might therefore indicate a high mortality rate for that specific condition.
- A shorter, lighter red bar indicates a lower lethality rate—often reflecting treatable or chronic conditions.
- No bar appears for test results or for conditions that do not typically lead to death or where no fatal cases have been reported.
Please note: As mentioned above, our statistics rely on user-contributed data. In practice, users are often more likely to record a disease when it resulted in a death than when it was "merely" diagnosed and successfully treated or managed over time. Additionally, the health issue list does not currently track the time elapsed between diagnosis and death. As a result, the displayed death rate scores may be skewed toward higher percentages than in clinical reality.
Filtering health issues
To help you find specific information quickly, we have included interactive filters above the table.
Type at least three letters into the "Filter health issues" field to instantly filter the list by disease or test name.
The "Show only causes of death" checkbox filters the entire table to display only conditions that were explicitly reported as a cause of death, updating both the list of entries and their corresponding counts.
Detailed test breakdowns
For entries involving diagnostic tests with variable outcomes (such as DNA tests, hip, elbow, or patella evaluations), you will notice a magnifying glass icon next to the test name. Clicking this icon opens a pop-up detailing the exact breakdown of the recorded results.
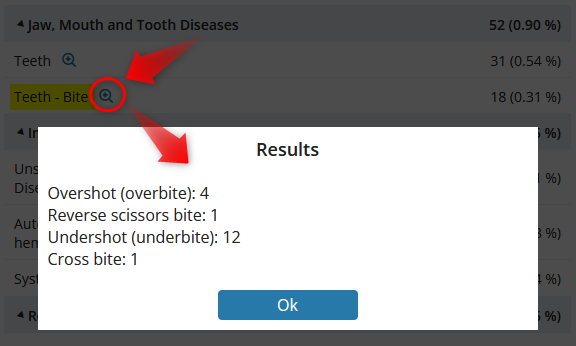
Please note: In our statistics, any result that deviates from "normal" or "optimal" (such as at risk genetic status, one missing tooth, or an LTV 1 spinal evaluation) is counted as a health issue. The pop-up allows you to see the exact breakdown so you can evaluate the specific severity levels for yourself.